Overview
This end-of-year review lesson uses the Brexit Results 2016 map set on geteach.com to connect four AP Human Geography topics in a single, map-driven activity. A decade after the referendum, Brexit remains one of the most geographically rich case studies available for the AP exam—touching on scale of analysis, centrifugal and centripetal forces, supranationalism, and international trade all at once.
The map set has eight layers organized along two dimensions: scale of analysis (national → sub-national nations → regions → local) and color complexity (simple binary vs. gradient choropleth). That structure is not accidental—it is the core of the lesson.
AP Human Geography Alignment
- Topic 1.6 — Scales of Analysis
- Topic 4.8 — Supranationalism
- Topic 4.9 — Challenges to State Sovereignty (Centrifugal and Centripetal Forces)
- Topic 7.6 — Trade and the World Economy
- Learning Objective PSO-7.A: Explain causes and geographic consequences of recent economic changes such as the increase in international trade, deindustrialization, and growing interdependence in the world economy.
- Essential Knowledge PSO-7.A.2: Neoliberal policies and free trade agreements (specifically analyzing the EU).
- Essential Knowledge PSO-7.A.3: Government initiatives at all scales and their effects on economic development, including tariffs.
Background Reading: Brexit, A Decade Later (2016–2026)
On June 23, 2016, the United Kingdom held a historic national referendum to answer a single question: Should the UK remain a member of the European Union, or leave it? In a result that shocked the global political and economic establishment, the UK voted to leave by a narrow margin: 52% Leave to 48% Remain.
To understand this vote, you have to understand the competing forces at play:
- The “Leave” Campaign: Driven by a desire to “take back control,” Leave voters argued that EU membership eroded British sovereignty. They wanted the UK to have full control over its own borders, immigration policies, and laws, free from the regulations of a supranational organization based in Brussels.
- The “Remain” Campaign: Driven by economic pragmatism, Remain voters emphasized the massive benefits of the EU’s single market. They argued that frictionless trade, tariff-free supply chains, and the freedom of movement for workers were essential to the UK’s economic survival and global influence.
The 10-Year Reality
“Brexit” (British exit) was not an overnight event. It took years of painful political negotiations to untangle decades of integration. The UK officially left the EU in 2020. Today, a decade after the original vote, the UK continues to navigate the complex economic and political realities of standing outside Europe’s massive neoliberal trade bloc.
The Geographic Puzzle
If you look only at the final national score—52% to 48%—you might assume the entire country was evenly divided. But geography tells a different story. The vote fractured the UK along national borders, regional economies, and urban/rural divides. In this activity, we will use maps to uncover exactly where the UK divided, why those divisions happened, and what it tells us about scale, supranationalism, and global trade.
Essential Question
What does the 2016 Brexit vote reveal about the relationship between scale of analysis, centrifugal forces, supranationalism, and global trade interdependence—and how have those geographic realities played out a decade later?
Understanding the Map Set
Before launching the lesson, it helps to understand how the eight layers are structured. Students will need to load these layers onto the dual map canvases in geteach.com.
To load a layer, students must complete the following steps on both map canvases:
- Click Select Map in the bottom right corner of the canvas.
- Choose Special Collections.
- Select Brexit.
- Click any layer name to load it onto that canvas.
Note: Because geteach.com uses a dual-canvas layout, students will repeat this process on both the left and right map canvases to compare different layers side-by-side.
The Four Simple (Binary) Layers
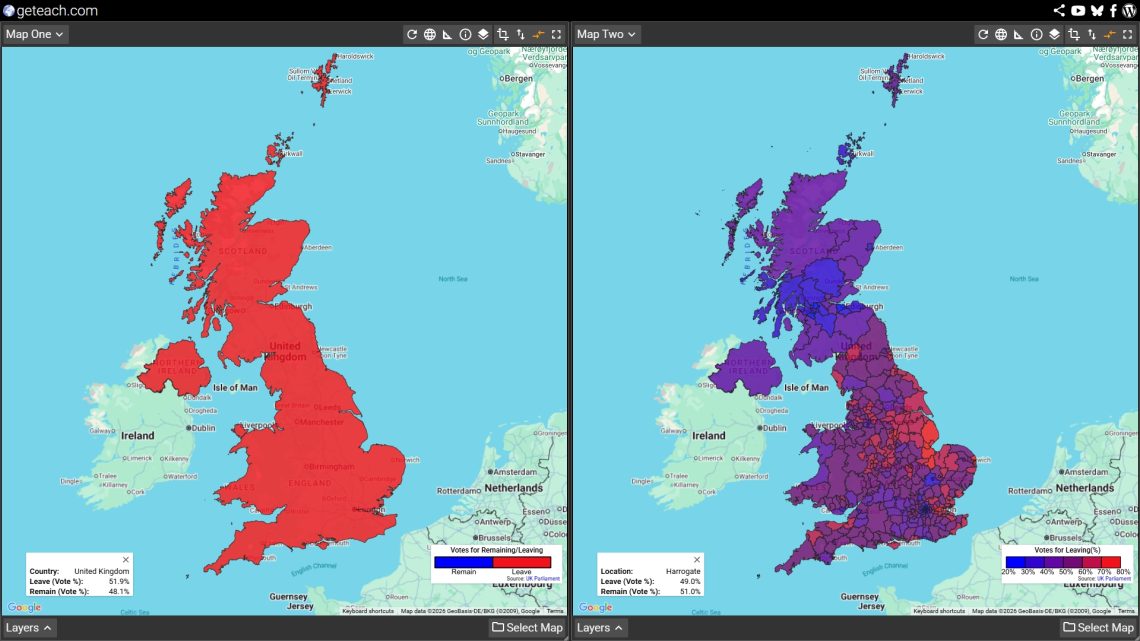
These layers use only two colors: blue for Remain and red for Leave. The outcome at each geographic unit is shown as a clean win/loss with no information about the margin of victory.
- United Kingdom (Simple): The entire UK as a single unit. One color. One result. Useful only as a starting point.
- UK Nations (Simple): England, Scotland, Wales, and Northern Ireland shown as four units. The Scotland/Northern Ireland vs. England/Wales divide becomes immediately visible.
- UK Regions (Simple): The nine regions of England plus the other nations. London appears as a Remain outlier inside a Leave-voting England.
- UK Local (Simple): Individual local authority areas across the whole UK. The urban-rural patchwork becomes clear at this scale.
The Four Gradient (Complex) Layers
These layers use a color gradient from deep blue (strong Remain) to deep red (strong Leave), ranging from 20% to 80% Leave vote in 10-point intervals. Areas where the vote was close—roughly 40% to 60% Leave—appear in shades of purple. These are the genuinely contested places.
- United Kingdom (Complex): Gradient applied to the whole UK as one unit. Shows the overall national margin.
- UK Nations (Complex): Gradient by nation. Students can compare how strongly Scotland voted Remain versus how narrowly Wales voted Leave.
- UK Regions (Complex): Gradient by English region plus nations. The variation within England becomes visible; some regions voted Leave by large margins, others by very thin ones.
- UK Local (Complex): The most detailed view. A genuine heat map of Euroskepticism across the UK, with university cities and urban cores often appearing as blue islands inside a red countryside.
How to Set Up geteach.com for This Lesson
The dual-canvas layout in geteach.com is what makes this lesson work. Here is a step-by-step setup for each activity.
Loading a Layer
- Go to geteach.com.
- Click Select Map at the bottom right of either map canvas.
- Choose Special Collections from the menu.
- Select the Brexit map set.
- The layer panel will open. Click any layer name to load it.
- Repeat on the second canvas to load a different layer for comparison.
Interacting with the Data
Click for Exact Percentages: On any layer, students can click directly on a specific polygon (a nation, region, or local authority) to reveal a pop-up showing the exact Leave and Remain voting percentages for that specific geographic unit. This is highly recommended during the gradient layer activities so students can investigate exactly how close the margins were in the contested areas.
Recommended Canvas Pairings by Activity
Note: The Synchronize Maps feature (found in the Map Canvas caret menu) is turned on by default. Leave this enabled so both canvases pan together as students compare layers. This keeps both maps centered on the same area while showing different data.
| Activity | Left Canvas | Right Canvas | Why This Pairing Works |
|---|---|---|---|
| Warm-up | United Kingdom (Simple) | United Kingdom (Complex) | Same scale, different classification. Students see what binary hides. |
| Scale walk | UK Nations (Complex) | UK Local (Complex) | Largest and smallest aggregation side by side. The scale of analysis shift is clearly visible. |
| Forces analysis | UK Nations (Simple) | UK Nations (Complex) | Students classify forces per nation, then check margin strength on the gradient. |
| Trade geography | UK Regions (Complex) | UK Local (Complex) | Region-level economic patterns visible, with local detail available for drill-down. |
| Retrospective | UK Nations (Complex) | UK Regions (Complex) | Return to the sub-national picture to anchor the 10-year discussion. |
Sharing a Pre-Configured View
You can set up the exact canvas configuration you want—layers, zoom level, map position, legend visibility—and then click the Share icon to generate a single link. Paste that link into your LMS or Google Classroom, and students will open geteach.com already configured for the activity. No setup steps are needed on their end. See the geteach.com share function guide for details: geteach.com/blog/2026/03/20/new-share-function-geteach-com/
Lesson Sequence
Activity 1 — Binary vs. Gradient Warm-Up (Topic 1.6)
Load United Kingdom (Simple) on the left and United Kingdom (Complex) on the right. Ask students: What does the map on the left tell you? What does it hide? Then ask them to look at the right canvas. What new information appears?
The goal here is not Brexit—it is cartography. Classification choices shape what a map communicates. The simple layer shows a winner. The gradient layer shows a margin. Neither is wrong, but they tell different stories. This is the core idea of Topic 1.6 before any political geography even enters the room.
Activity 2 — The Scale Walk (Topic 1.6)
Have students work through the gradient layers from largest to smallest aggregation: United Kingdom → UK Nations → UK Regions → UK Local. For each layer, they record three things: the areas of deepest blue, the areas of deepest red, and the areas that appear purple (contested).
Key discussion question: The UK voted 52% Leave at the national scale. Does that match what you see at the local scale? How does changing the scale of analysis completely change the story the map tells? London is the most productive example: at the national or regional scale, its massive Remain vote is hidden by the broader Leave-voting English data. But at the local scale, it reappears as a strong blue island surrounded by Leave-voting outer boroughs and the Home Counties.
Activity 3 — Supranationalism & Centrifugal Forces (Topics 4.8 & 4.9)
Load UK Nations (Simple) on the left and UK Nations (Complex) on the right. Using the four nations as the unit of analysis, students identify centripetal forces that held each nation to a Remain position and centrifugal forces that pushed toward Leave.
Productive examples by nation:
- Scotland (Strong Remain): Centripetal forces included EU single market access for agriculture and fishing, and a strong Scottish national identity that was pro-European rather than anti-Westminster. The ongoing independence movement saw EU membership as compatible with Scottish sovereignty.
- Northern Ireland (Strong Remain): Centripetal forces included the Good Friday Agreement’s open border with the Republic of Ireland, cross-border economic integration, and EU structural funds. A Leave vote carried the threat of a hard border—a genuinely destabilizing centrifugal force.
- Wales (Narrow Leave): Despite receiving substantial EU structural funds, Wales voted Leave. This is a highly productive tension for students to examine regarding cultural vs. economic priorities.
- England (Leave): Centrifugal forces included concerns about immigration and sovereignty, a sense that EU institutions were unaccountable, and geographic/cultural distance from the visible benefits of EU membership.
Closing Meta-Question: Is Brexit itself a centrifugal or centripetal force? At the global regional scale (Europe), it is centrifugal, pulling the UK out of the supranational bloc. But at the sub-national region scale (within the UK), it also functions as a centrifugal force, intensifying Scottish independence pressure and complicating Northern Ireland’s constitutional status.
Activity 4 — Trade Geography (Topic 7.6)
Load UK Regions (Complex) on one canvas and zoom to England. This activity connects the vote geography directly to the causes and consequences of international trade (PSO-7.A). Walk students through each essential knowledge point using the map as evidence:
- PSO-7.A.1 (Comparative advantage & complementarity): Which UK regions had the most to gain from EU single market access? London’s financial services, the Southeast’s knowledge economy, and Scotland’s agricultural exports all had strong comparative advantages within the EU framework. Ask: Does the gradient map reflect which regions felt those advantages most?
- PSO-7.A.2 (Neoliberal trade blocs): The EU is a primary example of this concept. Brexit is the ultimate case study of a state exiting a bloc. What spatial connections (supply chains, labor movement, cross-border investment) were disrupted?
- PSO-7.A.3 (Tariffs & government policy): Post-Brexit tariff and customs arrangements completely reshaped economic geography. Northern Ireland is the sharpest example: the Windsor Framework created a different trade relationship for Northern Ireland than for the rest of the UK, effectively meaning two different regulatory environments within one sovereign state.
- PSO-7.A.4 (Interdependence & shifting connections): The UK has since signed trade agreements with Australia and Japan, and joined the CPTPP. Ask students: Do these new connections replace the geographic proximity of the EU, or do they represent a fundamentally different kind of global interdependence?
A productive geographic puzzle: The regions that voted most strongly for Leave (parts of the East Midlands, the Northeast, Wales) were often among the largest recipients of EU structural funds and had significant EU trade exposure. Why might regions that economically benefited from EU membership vote to leave? This forces students to weigh economic geography against cultural and political geography.
Activity 5 — A Decade Later: Retrospective Synthesis (Topics 4.8, 4.9, 7.6)
Return to the UK Nations and UK Regions complex layers. A full decade has passed since the 2016 referendum. Use the maps as a spatial anchor for a 2026 retrospective discussion.
Discussion prompts:
- Did the reality of Brexit resolve the centrifugal pressures visible in the 2016 map, or intensify them? (Consider the modern Scottish independence movement, the Northern Ireland border realities, and shifting demographics).
- The purple zones on the gradient layers—the genuinely contested 40–60% areas—represent places where geography did not produce a clear consensus. Ten years on, have those local communities resolved their economic and political tensions, or does the data suggest it persists?
- Looking at the global economy today, has the UK successfully replaced EU trade interdependence? What does the current geographic evidence suggest about whether distant bilateral agreements can compensate for the loss of a neighboring regional trade bloc?
Discussion Questions by Topic
- Topic 1.6: At the national scale, the UK voted 52% Leave. At the local scale, London voted roughly 60% Remain. How does this illustrate the limitations of national-scale analysis for understanding geographic patterns?
- Topic 4.8: What specific benefits of EU supranationalism did Scotland and Northern Ireland rely on that England largely dismissed? Why might spatial geography—not just politics—explain that difference?
- Topic 4.9: Is Brexit itself a centrifugal or centripetal force? Does your answer change depending on whether you analyze it at the UK-EU scale versus the within-UK scale?
- Topic 7.6 (PSO-7.A.2): The EU is a prime example of a neoliberal trade organization. Using the gradient map, which UK regions appeared most spatially dependent on EU trade networks in 2016? Which appeared least?
- Topic 7.6 (PSO-7.A.3): How did post-Brexit tariff and customs policy ultimately affect Northern Ireland differently from England? What does this reveal about the relationship between government scale and trade geography?
- Synthesis: A classmate argues Brexit was “just politics, not geography.” Using all four AP HUG topics discussed today, write a 3–4 sentence rebuttal.
FRQ-Style Assessment Prompt
Refer to the 2016 Brexit referendum map at the regional scale using the gradient color scheme on geteach.com.
(A) Describe the geographic pattern of the Leave vote across UK regions.
(B) Explain how changing the scale of analysis from regional to local would alter the interpretation of this pattern.
(C) Using ONE centrifugal force and ONE concept from the causes and consequences of international trade, explain why the pattern you described exists.
Teacher Notes
- If you are using the lesson with a class set of devices, the Share function is the most efficient setup tool. Configure each activity’s canvas pairing, generate a share link, and distribute it via your LMS before class. Students click the link and land in exactly the right configuration. geteach.com/blog/2026/03/20/new-share-function-geteach-com/
- The full standards alignment reference for all geteach.com layers—including the Brexit map set’s alignment to Geography for Life Standards 5, 6, and 13—is available at geteach.com/blog/2026/03/16/map-layers-curriculum-alignment/.