TL;DR: Google Earth Projects: Dynamic Landscapes (Link to Projects)

One of my favorite concepts to teach and think about is this idea of scale and how our landscapes constantly change. Google Geo has a couple of tools that help capture both these concepts. First, Google has organized years of remote sensing images from several vendors. Many students and teachers have used Google Earth Engine’s Timelapse and/or have used Google Earth Pro’s (Desktop) “Historic Imagery.” With these tools, viewers can see a changing landscape from above. For example, the images below, from Google Earth Pro’s Historic Imagery, visualize Warsaw Poland in 1935 and 1945. In addition, Google Maps, not Earth, has historic Street View going back, in some places, for 15 years.


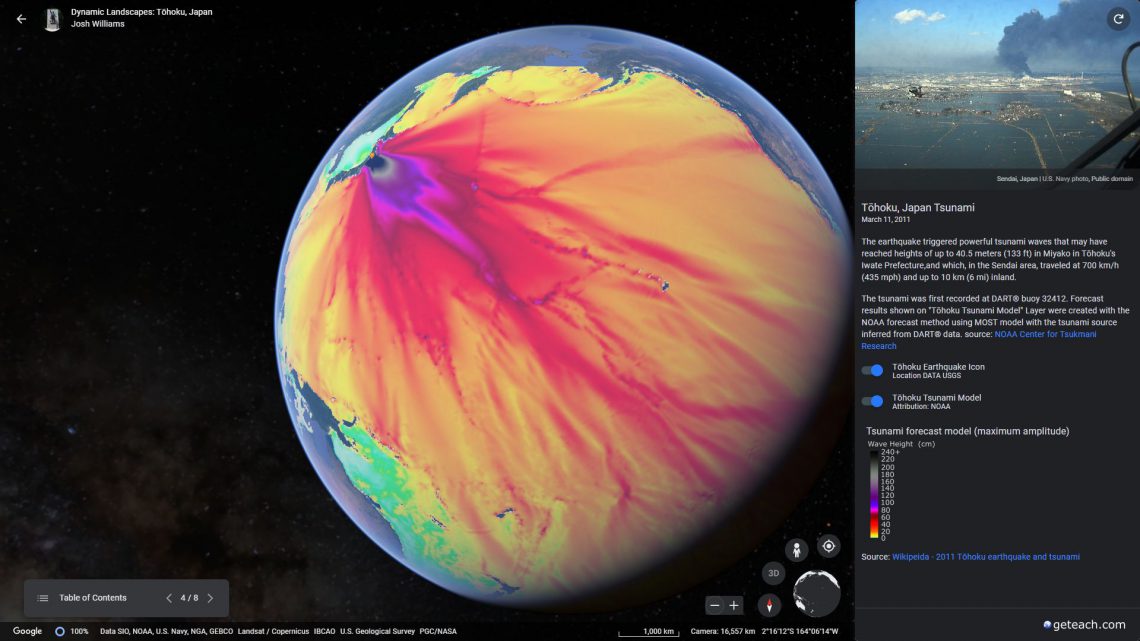
The goal of these Google Earth projects is to tell stories using these concepts of spatial and temporal scales. The four stories chosen to tell using these scales include the 2013 EF5 Tornado in Moore, OK; 2011 wildfires in Bastrop, TX; the 2011 Tōhoku Earthquake/Tsunami; and finally, the Notre-Dame Cathedral fire in Paris, France.

While these catastrophes are life altering to those living thorough these events, I find it, as a teacher, easier to create empathy in students when these events can shift between small-scale/small detail to large scale large detail. In other words, at a small-scale students can see the extent of how much was damaged, but might miss the personal stories of loss, heroism, and perseverance. Shifting the perspective to the large-scale/large detail of Street View gives a glimpse of these personal narratives. Hopefully facilitating the growth of an empathetic citizen willing to help their world.

On the technology side, there is a little of everything Google Geo has to offer. The stories themselves are curated Wikipedia and US government websites using data from NOAA, FEMA, Google Earth Imagery, and Google’s Street View. The visual format of the stories’ panels were created using custom HTML with help from Google’s Material Design Lite and a little JS to show/hide layers and style the media. The Google Earth Layers are all tiled (x,y,z) raster images either created using MapTiler or, in some cases, Google Earth Engine. The historic Street View panels are done using Google Maps API. And lastly Google Earth Studio was used to create the spinning Earth found in the Dynamic Landscapes’ Main Menu project.

In other words, these stories are an experimental convergence of hacks. And while I think they look fantastic; they will always be amateur. However, these stories could look so much more polished, and scalable, with a couple of Google Earth for Web features. First, historical imagery and historical Street View that could be included in Google Projects. Second, toggle switch widgets for showing/hiding layers. Third, and one that I have been unable to hack yet, would be the ability to “set a scene” by enabling and disabling Map Styles like visible features (roads, places, poi), 3d imagery and clouds:) The ability to add ground overlays would also be useful to many users. This would remove some friction that is introduced with tile overlays. Lastly, and this will probably make no sense to anyone, but the ability to assign Ids to features like placemarks (points, lines, polygons), ground overlays (tiles), folders, full screen panels, etc. While I am at it…maybe the Earth Engine team could help me out with exporting video (x,y,z) tiles from Earth Engine’s code editor. Very selfish request.
Anyways, please let me know via Twitter or Facebook if you would like for me to create a tutorial on anything you found interesting within these stories. I truly enjoy creating and learning from these experiences.