[earth_disclaimer]


Google Earth Projects ‘22
What a weird year! During the school year I spend most of my bandwidth teaching and learning with students. This often only leaves June, July, and a couple of weeks in December to maintain, clean, and update geteach.com. However, I also use this time to tinker with Google Earth. Here are my favorite projects of the year.
Please note that many of these stories work best without clouds, so you might want to click the Map Style icon and uncheck “Clouds” in the “Custom” option. Maybe toggle-off 3D buildings for some stories too.
Also, pro-Workspace EDU tip. Many EDU admins block sharing Docs, Sheets, and yes Google Earth projects from users outside the EDU organization. Simply open the shared link with your teacher’s account and make a copy. Then share the copied project with your students.
What are the different types of plate tectonic boundaries? (Link to Google Earth Story)
My favorite Google Earth Project is always the last one I created. In this case, it is a quick lesson on types of plate boundaries.
A component of most geography, and Earth science, courses include processes that create landforms. Divergent, convergent, and transform boundaries are inner-earth processes that are discussed in just about all these classrooms. NOAA has a great one pager (https://oceanexplorer.noaa.gov/facts/plate-boundaries.html) discussing these boundary types.
Add a couple of layers to a Google Earth project can easily create greater engagement for a static webpage with a lot of great information. In this case, the layers added are Earth’s Plates from the U.S. Geological Survey, a flashy plate boundaries map from NOAA, the tried-and-true Seafloor Age and 10,000 years of volcanoes maps from NOAA, and lastly, 5+ magnitude earthquakes from 2016.

What are El Niño and La Niña? (Link to Google Earth Story)
The 100 degrees started early in 2022. One day, I was reading about a double, and potential triple, dip La Niña. While falling down the rabbit hole, I ran across a NOAA page titled What are El Niño and La Niña? (https://oceanservice.noaa.gov/facts/ninonina.html). Maybe a day later the Earth project was completed with using tiled map layers of NOAA images.

Read more about the project here. (https://geteach.com/blog/2022/06/22/what-are-what-are-el-nino-and-la-nina-google-earth-project/)
Dynamic Landscapes Projects (Link to Google Earth Story)
Looking at changes through geographic and temporal scales is one of the engagement tools used when using Google Earth, or really any geo-technology, in the classroom.
For about five years now I have waited to import a csv file into an Earth Project, like in Google’s My Maps. In July, tired of waiting, I decided to import 2013 tornado data into Google’s Earth Engine and create an image file of this point data.
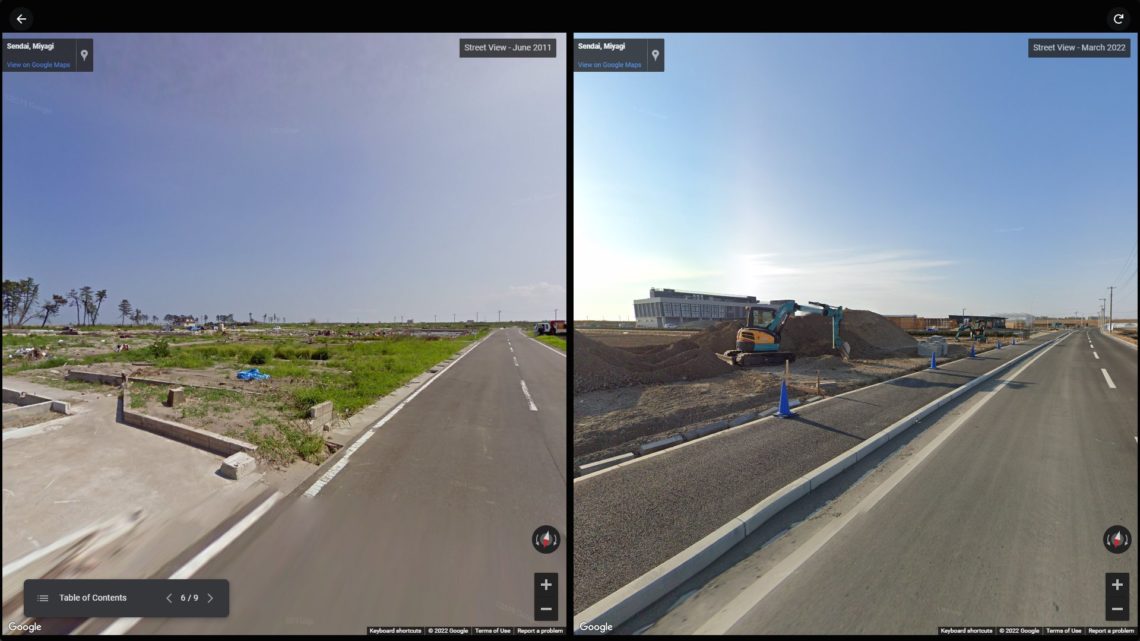
In addition to adding point data, I have always wanted to use historic Street View in a project. If I was going to use historic Street View in a project, I probably should use historic imagery too.
Put all these together and you create the Dynamic Landscapes Projects. These four stories (Tornado in Moore, OK; 2011 wildfires in Bastrop, TX; the 2011 Tōhoku Earthquake/Tsunami; and finally, the Notre-Dame Cathedral fire in Paris, France) look at these changing landscapes at different; the closest using historic Street View.


Read more about the project here. (https://geteach.com/blog/2022/07/23/new-geteach-com-google-earth-projects-dynamic-landscapes/)
Earth’s Changing Oceans (Link to Google Earth Story)
Technically created in October/November of 2021, this story illustrates the relationship between Earth’s oceans and climates. The information comes from the U.S. Environmental Protection Agency (https://www.epa.gov/climate-indicators/oceans).
The map layers are from various resources, mostly NOAA. The challenge with this project was, and still is, how to utilize Earth’s folder structure in a non-linear story. Hence the blue “BACK TO STORY” buttons at the bottom of some of the panels. This button gets the reader back to where they left off in the story.
A common “hack” in this in this project is in using the previous/next image in the carousel to also change the map overlay on Google Earth. Maybe one day I will find a more creative solution, but so far, I have not found one that works equally well across computers and phones.

Continental Drift (Link to Google Earth Story)
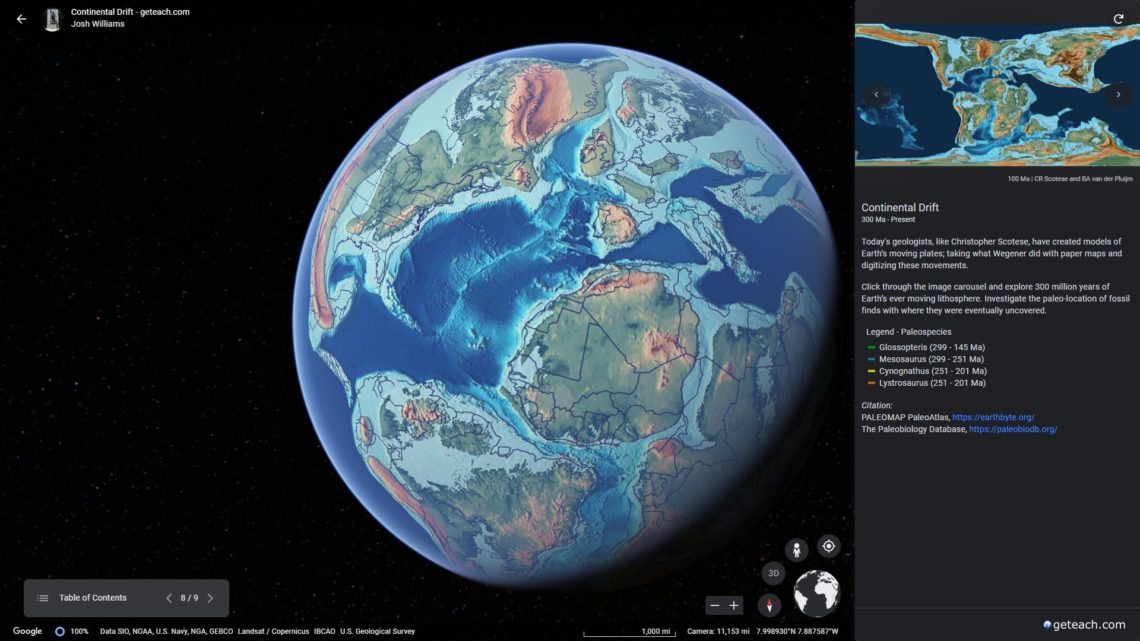
This story was first created in 2017 as a kml file. Over a year ago the Google Earth team added tile overlays to Earth Projects. This was one of those stories that fits well with this update. The story uses a Sci-Fi channel YouTube snippet about Alfred Wegner. From there, students can explore the distribution of ancient fossils that helped Wegner, and others, theorize continental drift.
The point data for Glossopteris, Mesosaurus, Cynognathus, and Lystrosaurus fossils comes from The Paleobiology Database (https://paleobiodb.org/#/). After a failed attempt to rasterize the points and create a tiled map, I manually added the fossil point data.
Like Earth’s Changing Oceans Project, clicking through the image carousel on slide eight changes the Earth; illustrating the breakup of Pangea to today’s present Earth.
I’m Australian Too! (Link to Google Earth Story)
A Google Earth Project read along was converted from a kml to a project this year using Earth Project’s folder structure.
Several years ago, I received permission from Ms. Fox’s publisher to create this story, “as long as I don’t make any money.” That was a very easy condition to meet, considering I’ve never made any money from any of my projects. This project is a great littles story about migration and the potential for progress among places.

Click this here if you would like to explore past Google Earth Projects created for the classroom.